Visualizing a Heat Pump in Grafana with InfluxDB

Grafana is a web application that can be used to display data graphically. A wide variety of chart types are available, such as line, pie, and bar charts. Data can be integrated via a large number of data sources, so-called Data Sources. Two of them, namely direct HTTP requests via Infinity and time series via InfluxDB, are used in the dashboards below.
Live dashboard directly from ems-esp
If you just want to take a look at the current measurement values and energy consumption and do not have a smart home system with a database, simply use the Grafana installer, which is available for Windows, Linux, and MacOS, and install Grafana on your computer.
Then you also need the Infinity Datasource. To do this, select Data sources under Connections in the Grafana menu. Clicking +Add new data source lets you add the Infinity Datasource to your Grafana.
This allows the entities to be retrieved and visualized directly via the ems-esp REST interface—without a database:

If you want to use this dashboard, you can download the configuration here:
- Light Theme: grafana-dashboard-emsesp_light.json
- Dark Theme: grafana-dashboard-emsesp_dark.json
In Grafana, open Dashboards, New, and Import, then insert the contents of the file into the text field. Then select Infinity as the Datasource, and you should see the dashboard above. If not, please create an Issue so that I can correct the guide.
Detailed information about the dashboard
The live display uses the so-called Canvas to visualize the current measurement values at the sensor locations.
Below that, you will see 2 sections.
One for typical key figures and, above it in the detailed view, the raw data on which the key figures were calculated.
Key figures:
- Performance factor: The total performance factor is the quotient of the total generated thermal energy (heat energy) and the electrical energy used for this purpose. Your performance factor should preferably be greater than 3.
- Heating performance factor: Similar to the performance factor above, with the difference that only the energy for heating operation is considered. The heating performance factor should also be greater than 3.
- Domestic hot water performance factor: As above, but for domestic hot water. The domestic hot water performance factor should be greater than 2.
- ⌀ Runtime / starts: Quotient of the total runtime (excluding standby) and the number of starts. This number should be as high as possible, i.e. there should be few cycles. If the value is less than one hour, the heat pump may be oversized or the settings may be incorrect.
- Heating vs. domestic hot water: Distribution of the generated heat energy between domestic hot water and heating
- Heat pump vs. auxiliary heater: Distribution of energy use between the heat pump and the electric auxiliary heater. It is absolutely fine if the auxiliary heater is used on the few cold days of the year. However, the auxiliary heater’s share should remain in the low single-digit range. If the share is higher, an incorrect installation or configuration could be the cause.
Historical data with InfluxDB
Electrical power used vs. heat output
If you also want to analyze historical data, it is preferable to install an InfluxDB, which is already available as an add-on for most smart home systems (Home Assistant, OpenHAB).
Do you have an InfluxDB? Then download this dashboard configuration:
- Light Theme: grafana-dashboard-emsesp-influxdb_light.json
- Dark Theme: grafana-dashboard-emsesp-influxdb_dark.json
Unfortunately, the various smart home systems use different types of storage. OpenHAB stores each entity as a Measurement table in the database:
| time | item | value |
|---|---|---|
| 1711055880009000000 | nrgtotal | 44.81 |
| 1711055940009000000 | nrgtotal | 44.84 |
| 1711056000008000000 | nrgtotal | 44.87 |
The InfluxQL queries in the dashboard above are based on this structure.
If you use a different type of storage, you may need to adjust the queries accordingly.
Each query is named after the ems-esp entity, e.g. nrgtotal or outdoortemp, and should therefore be easy to identify.
Detailed information about the dashboard
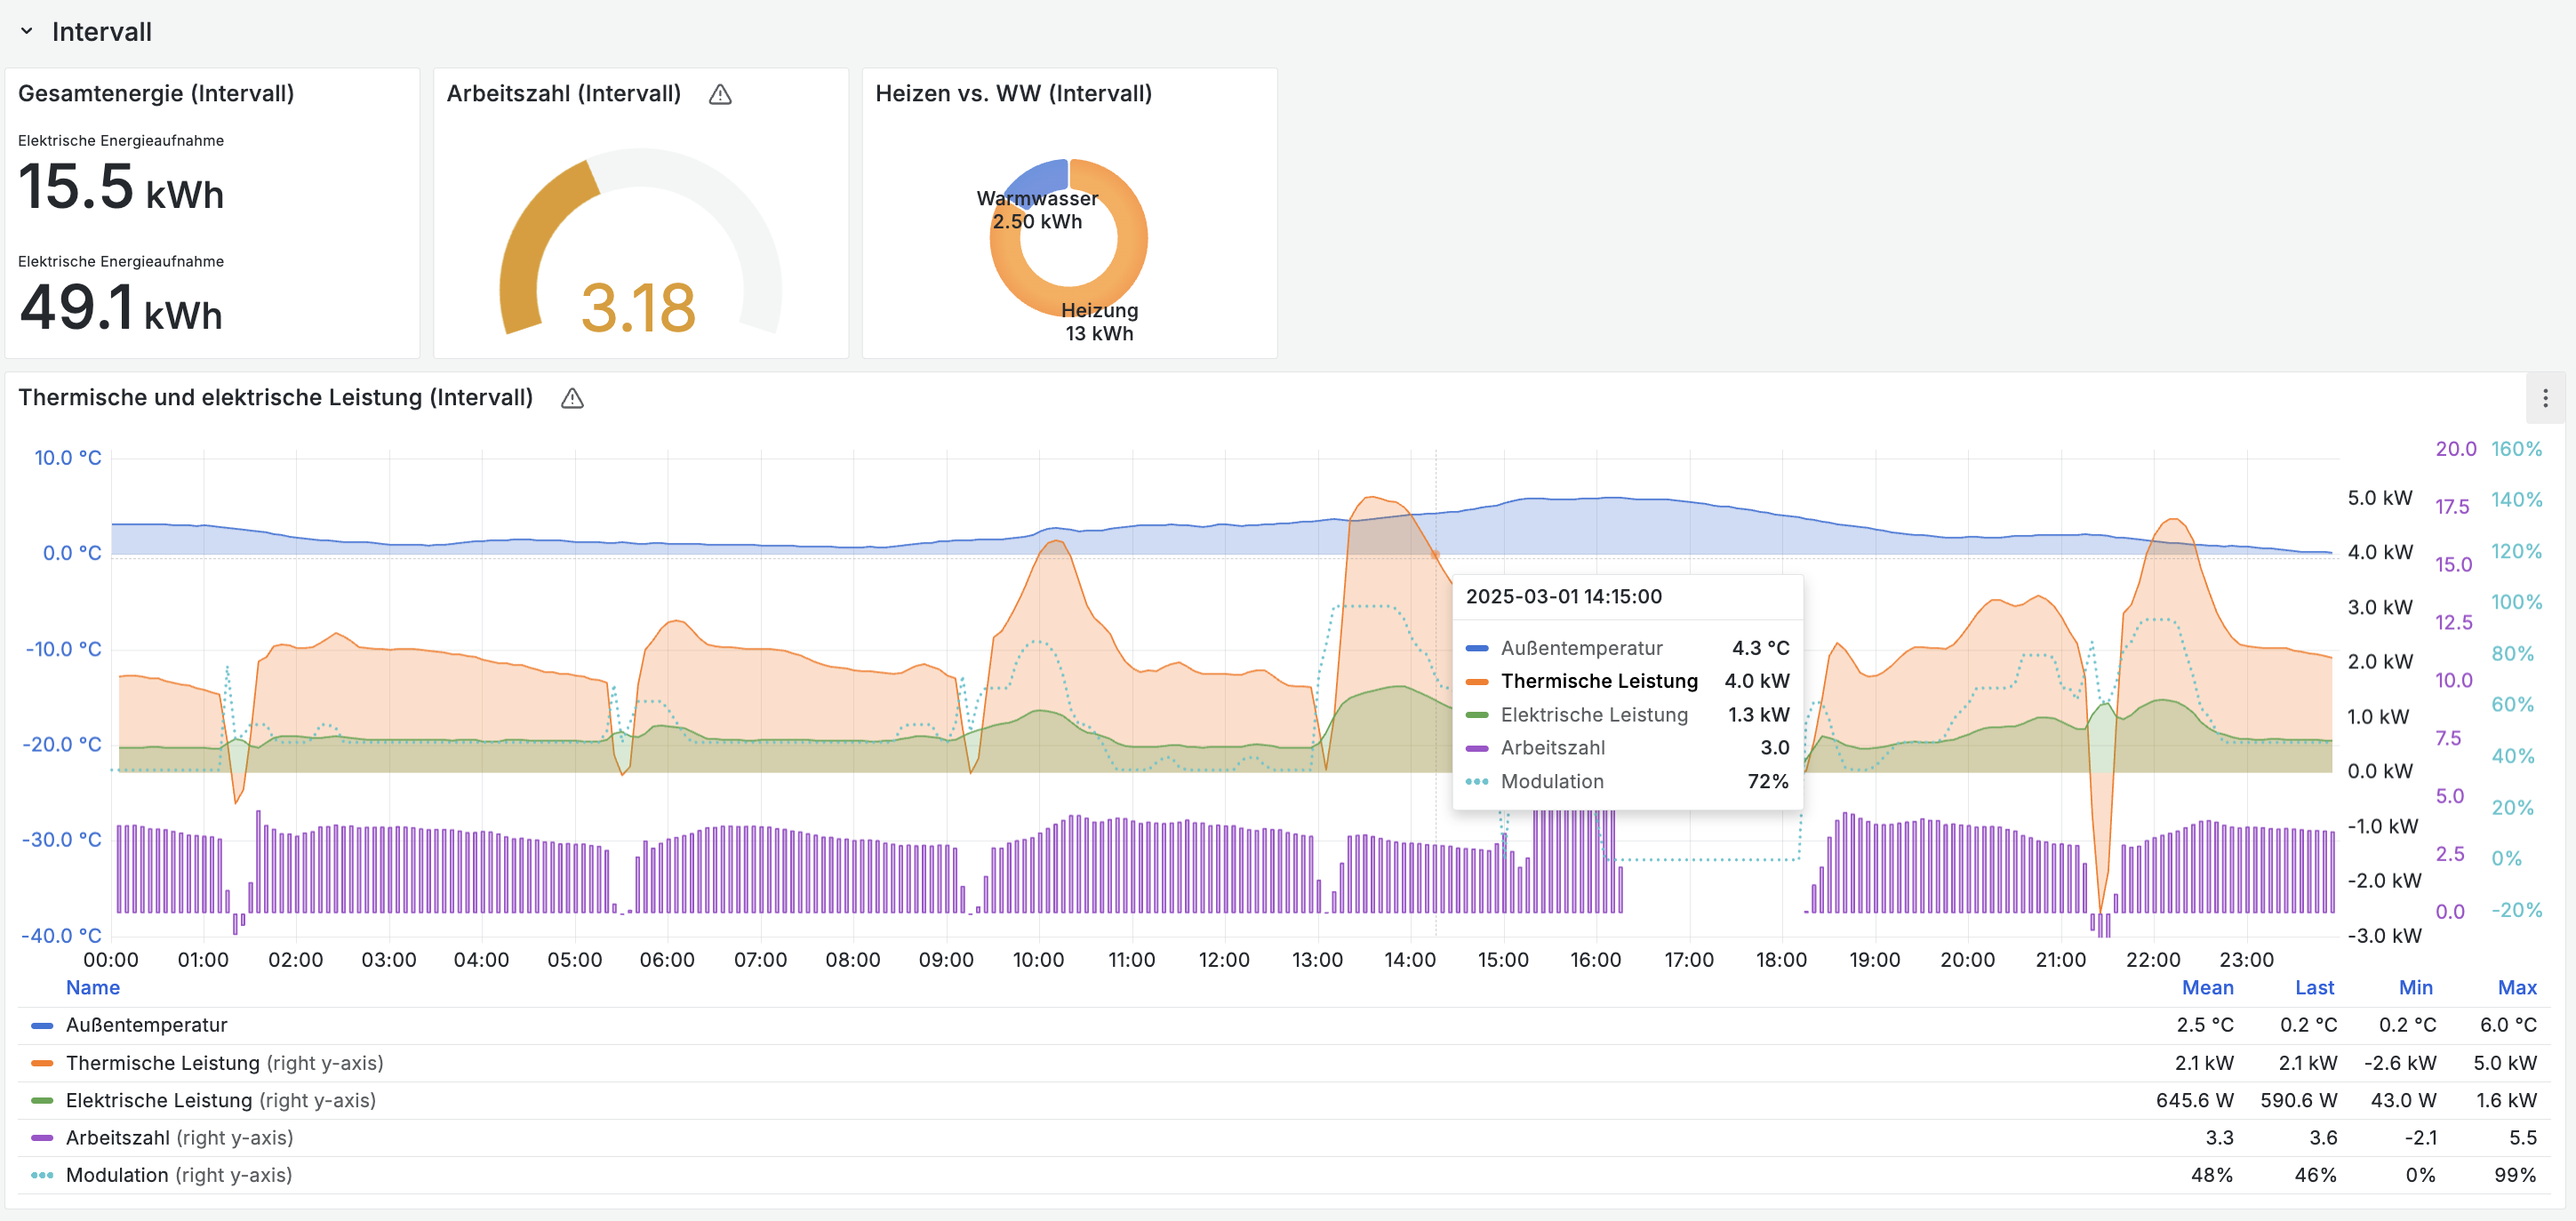
As described above, the dashboard shows energy used/generated, the performance factor, and the ratio between heating and domestic hot water, but this time not over the entire runtime, but for the selected time interval.
This allows you to determine at which outdoor temperature your heat pump cycles, how the performance factor changes, and how often defrost cycles are required.
The following data is displayed in the chart below:
- Electrical power: slightly smoothed entity hpcurrpower
- Thermal power: slightly smoothed derivative of the entity nrgtotal. The dips in thermal power with a negative performance factor are defrost cycles.
- Performance factor: Quotient of nrgtotal and hpcurrpower
- Modulation: Entity curbunpow
- Outdoor temperature: Entity outdoortemp
Daily energy use & domestic hot water temperature profile
The dashboard above also contains additional visualizations for the selected interval:
Detailed information about the dashboard
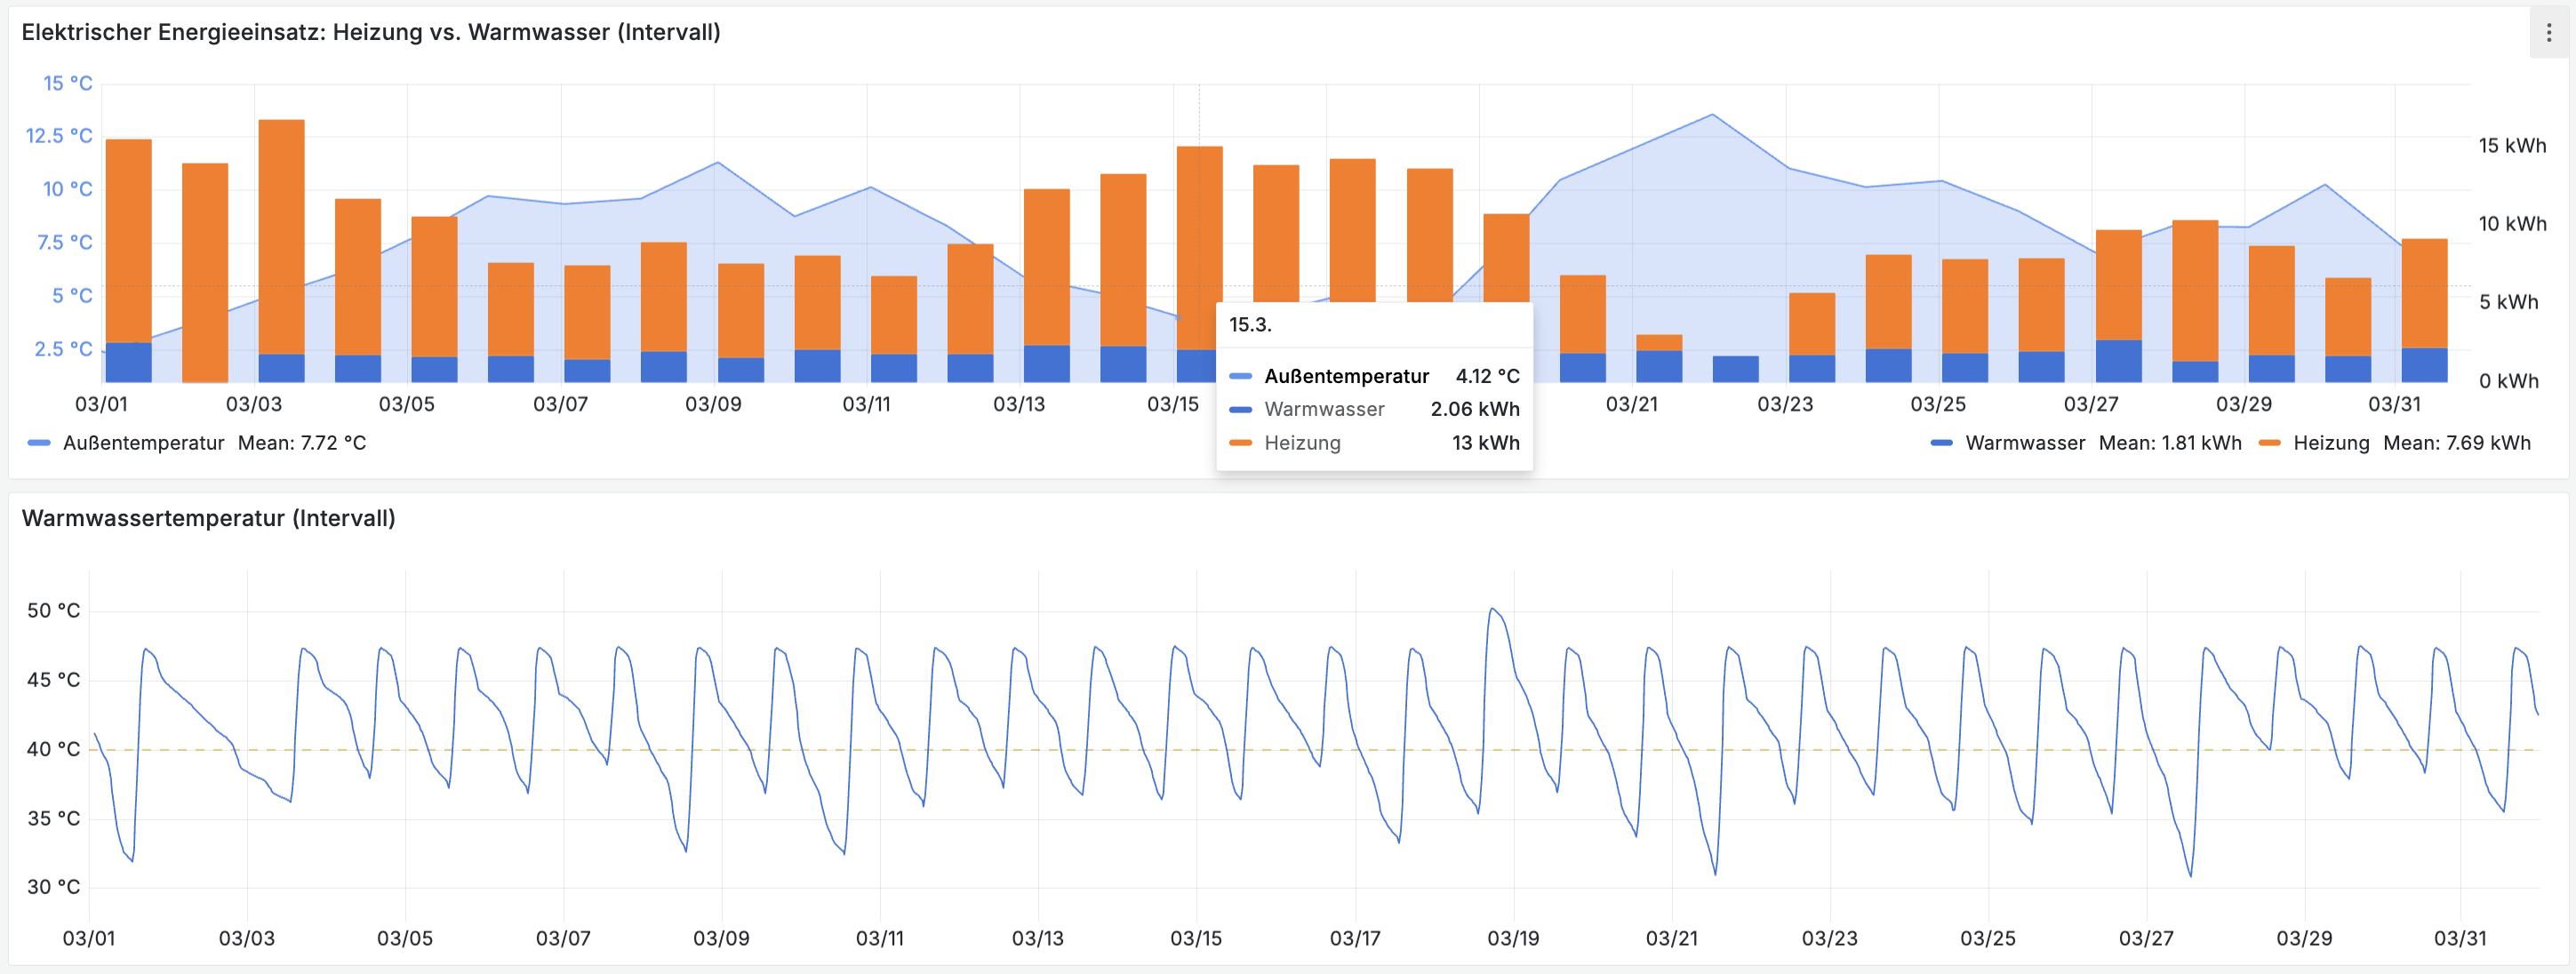
Daily energy use: heating vs. domestic hot water
This chart shows the daily energy use for heating operation and domestic hot water production. The average outdoor temperature for the day is displayed in the background. This makes it easy to see that more energy is required on colder days. The legend also lists the average energy used for heating operation (7.69 kWh) and domestic hot water production (1.81 kWh) per day—as well as the average temperature (7.72 °C) in the time interval.
Domestic hot water temperature profile
This chart shows the temperature profile over time for the water in the domestic hot water tank. This allows you to check how often and at what time of day your domestic hot water is heated (see also Optimizations). Under Thresholds in the visualization settings, you can enter your start temperature. Thresholds are displayed as a horizontal line.
Sustainability
The Sustainability section in the dashboard addresses the origin of the electrical energy used. It is based on the assumption that the electricity is obtained exclusively from the grid and not via an own PV system.
The following charts are created using data from www.greengrid-compass.eu:
To retrieve the data from www.greengrid-compass.eu, you must create a free API key on api-portal.eco2grid.com and enter it in Grafana under the dashboard settings in the api_key_ggc variable.
Detailed information about the dashboard
Daily CO2 emissions of the heat pump vs. a hypothetical gas heater
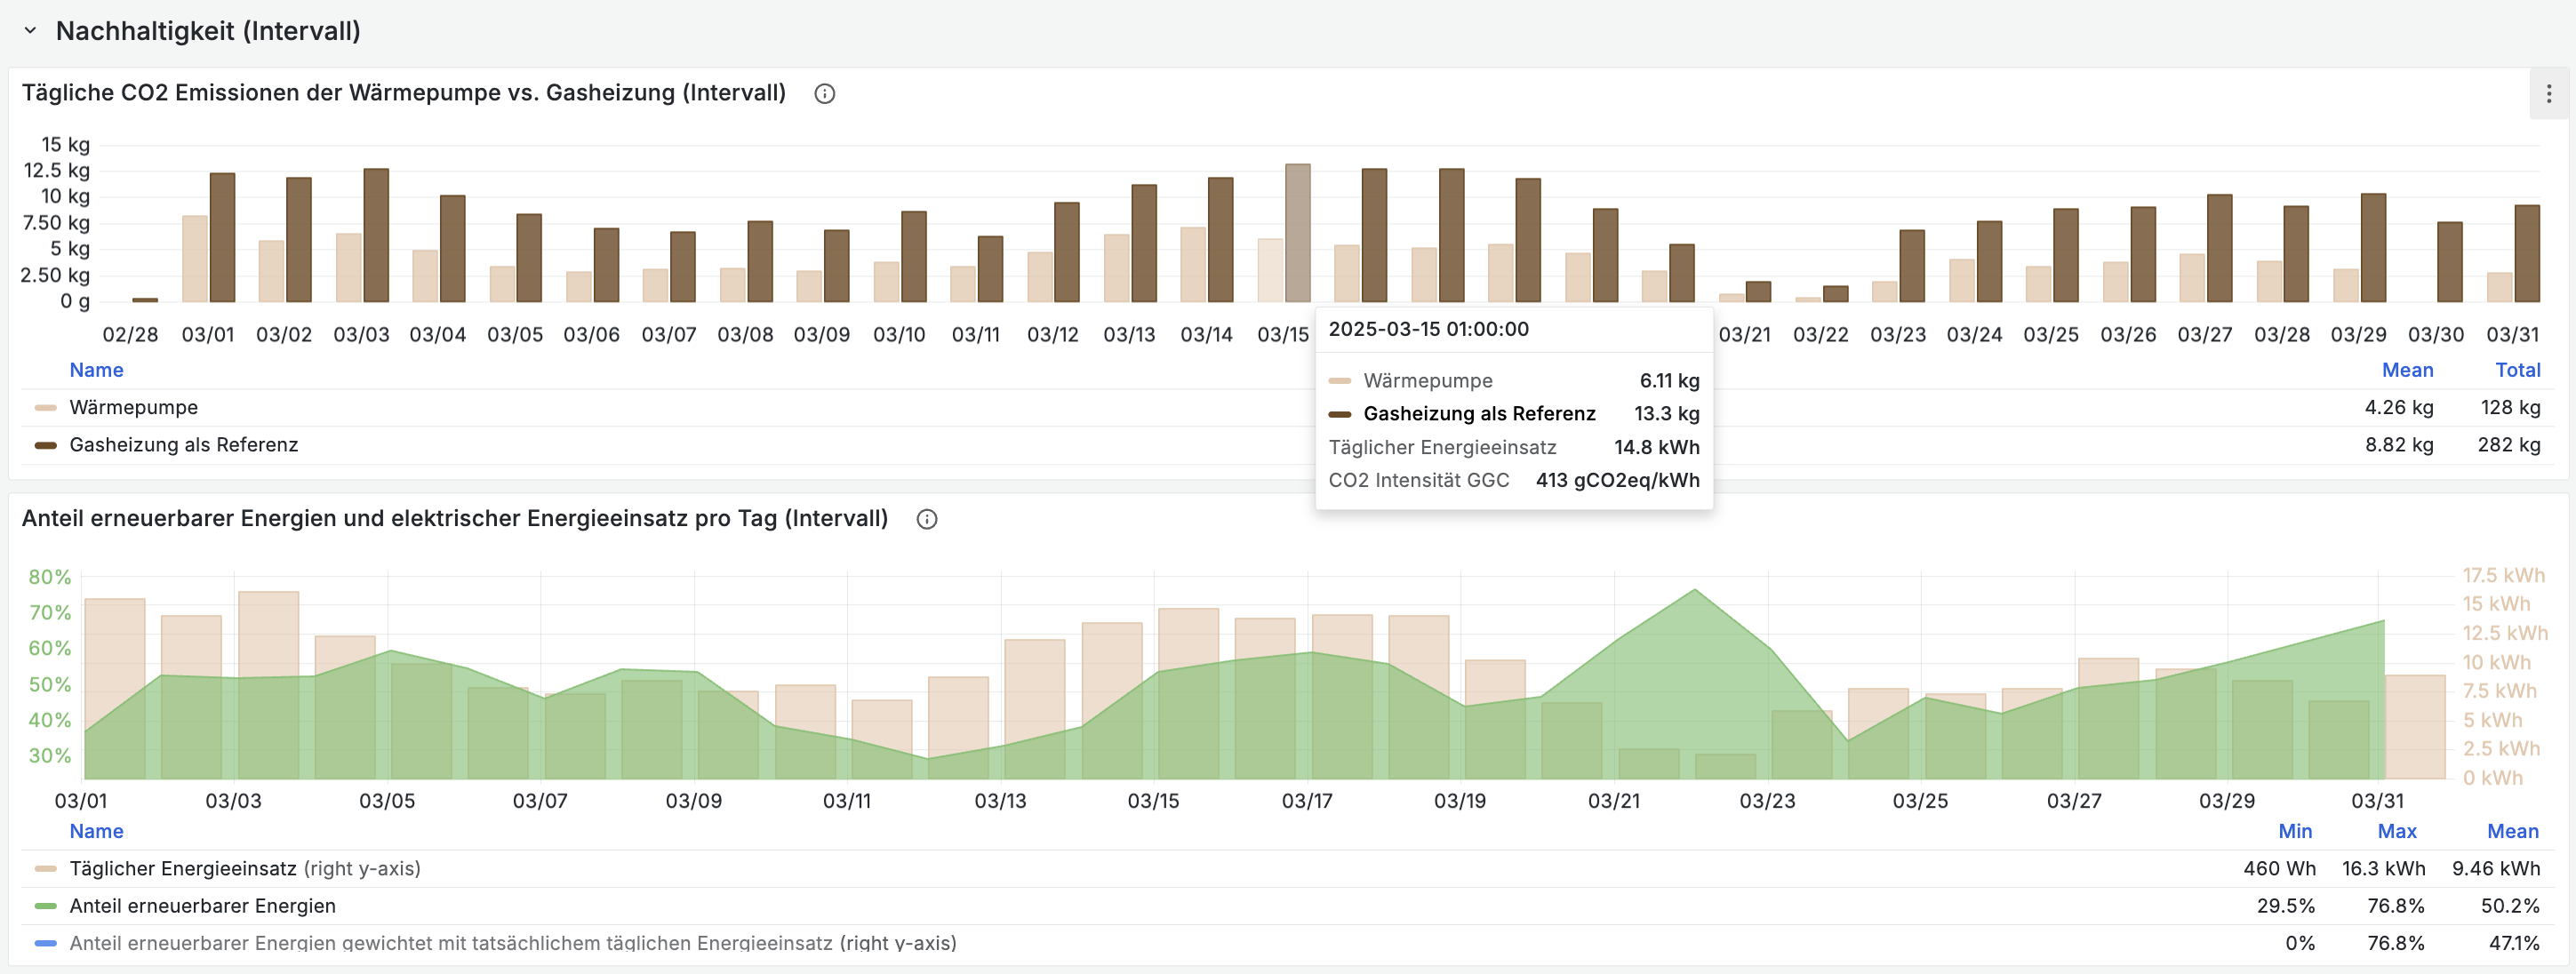
Grid electricity always consists of a mix of various energy sources. Some of them cause high CO2 emissions, while others cause very low emissions. In this chart, the daily electricity consumption is multiplied by the daily average CO2 emissions per kWh of grid electricity, and the daily CO2 emissions of your heat pump are displayed as a bar. For comparison, the value of a reference heating system, e.g. a gas heater, is displayed. The CO2 emissions of the gas heater can be set via the dashboard variable ref_heating_emissions. The default value is 250 gCO2eq/kWh.
Share of renewable energy and daily electrical energy use
This chart shows the share of renewable energy (solar, wind, hydro, biomass—no nuclear or fossil energy) in the interval. The daily energy demand is also shown in the background. Average values for the entire interval can be found in the legend. In the image above, the share of renewable energy in March 2025 amounted to 50.2%. On sunny days, the share of renewable energy is usually higher, but the heat pump’s energy consumption is lower (see March 22/23), and vice versa. Consequently, one might conclude that energy demand behaves inversely to the share of renewable energy. Therefore, the legend also includes another average value for renewable energy—but this time weighted by the heat pump’s daily energy use. In March, it amounted to 47.1%—slightly below the unweighted average, but only a few percentage points away from it.
Further visualizations on the efficiency of the heat exchangers and other analyses will soon be available at https://github.com/bosch-buderus-wp/grafana-dashboards.