Matthias Bosch CS6800i AW
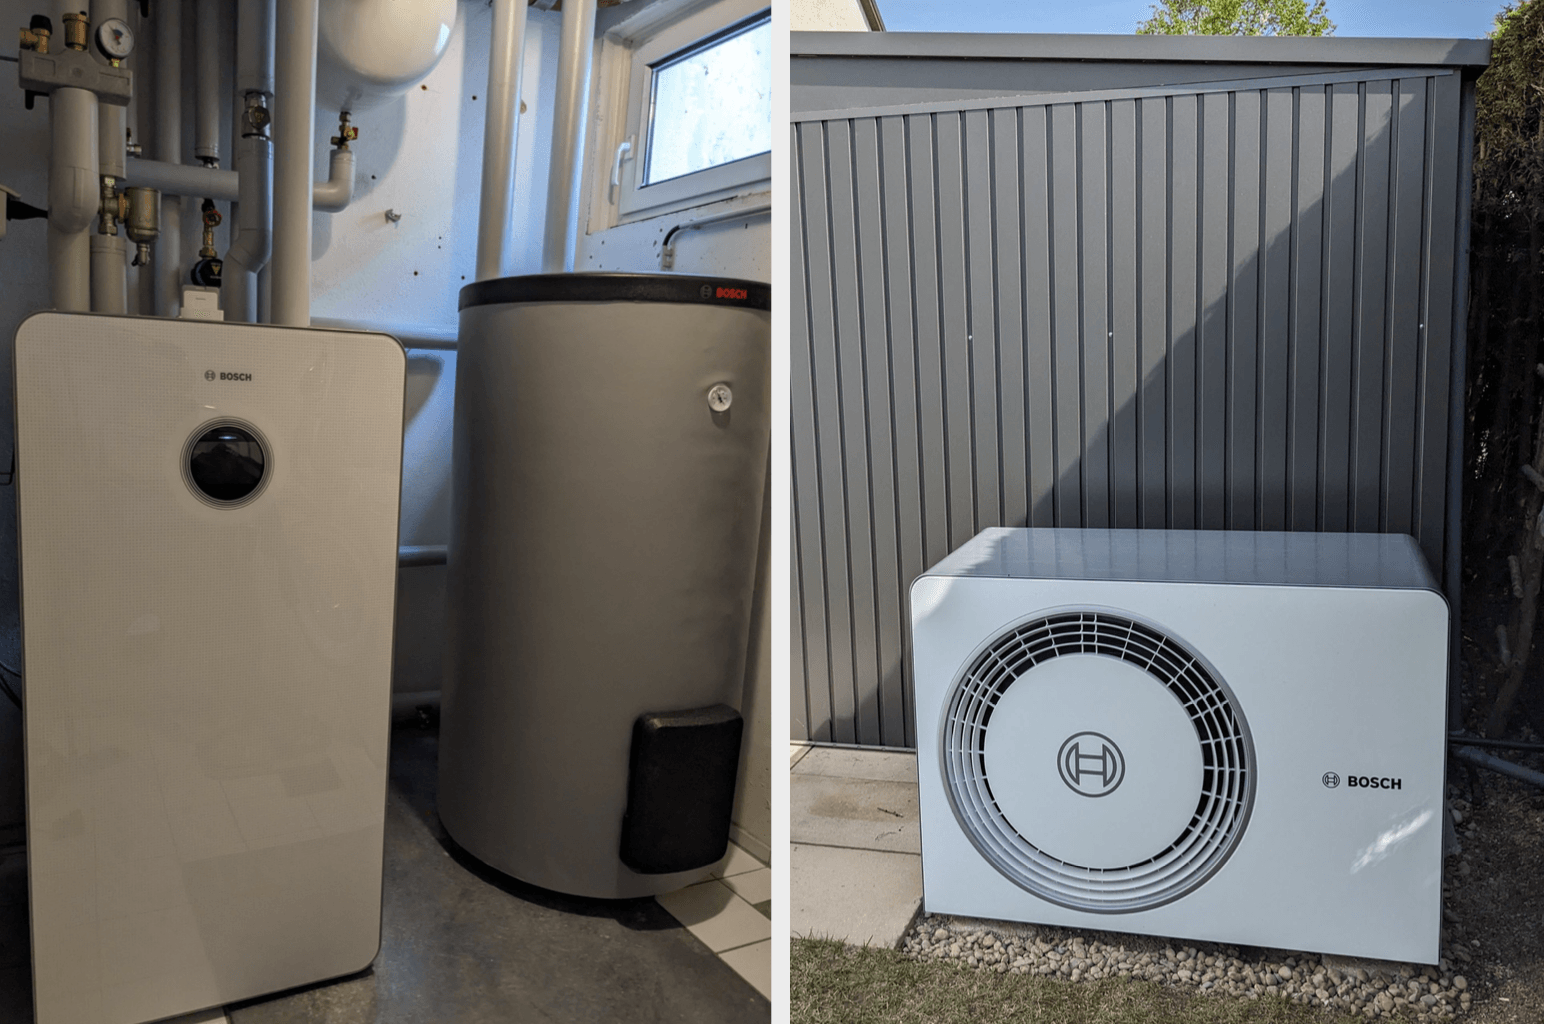
We have been using the Bosch Compress CS6800i AW 12 MB with the AW 4 OR-S outdoor unit since March 2024 and have been very satisfied so far. The outdoor unit is extremely quiet, the house and domestic hot water reach the desired temperature, and the price was absolutely fair. Competent heating contractors are nearby and respond quickly when something does not work. Bosch can also be reached and has already carried out two software updates to resolve issues. We would therefore recommend the system with a clear conscience.
Building
- Semi-detached house
- Year of construction: 1998
- Heated area: approx. 110 m2
- Type: underfloor heating + domestic hot water production
- Daily domestic hot water consumption: approx. 150l
- Heating limit temperature: 15 °C
- Standard outdoor temperature (NAT): -13.6 °C
- Heating load: 4.7 kW
- Previous gas consumption: 13,000-15,500 kWh/year
Heat pump
Heating system
- Indoor unit: Bosch Compress CS6800i AW 12 MB
- Software version: 12.11.1 (previously 9.6.1 and 23.08.08-5.35)
- Outdoor unit: AW 4 OR-S
- Software version: 9.15.0 (previously 9.6.0 and 23.08.08-5.35)
- Domestic hot water tank: WH 290 Stora domestic hot water tank (277 l)
Design parameters
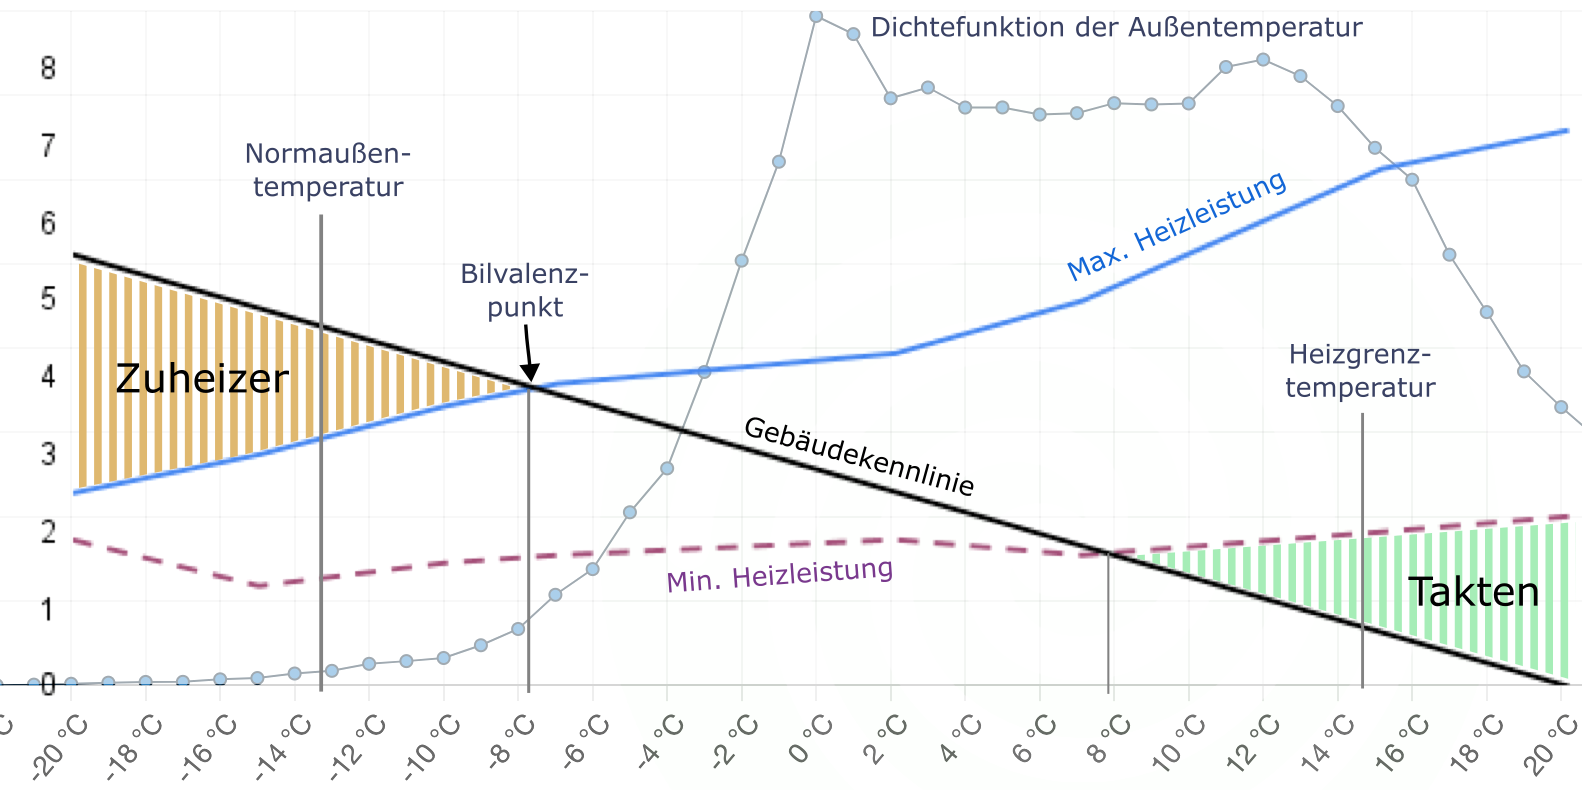
- Bivalence point: -8 °C
At temperatures below -8 °C, the electric backup heater provides support. According to the Bosch design tool, the electric backup heater requires only 100 kWh per year (< 1%). - Cycling limit: 8 °C
From 8 °C onward, the heat pump can no longer modulate lower and therefore has to cycle up to the heating limit temperature of 15 °C. - Peak output coverage at the NAT: 66%
At -14 °C, 66% of the heat (approx. 2.9 kW of 4.3 kWh) is generated by the heat pump and 33% by the backup heater [Bosch design tool].
Settings
- Temperature difference of the primary circuit (TC3-TC0): 3.5 K
- Differential pressure PC1: 150 mbar (at persistently cold temperatures, we increase this to 300 mbar)
- Flow temperature (NAT): 39 °C
- Heating limit temperature: 15 °C
Efficiency
Consumption figures
| Value | Year 1 | Year 2 |
|---|---|---|
| Electrical energy input | 3,100 kWh | 3,100 kWh |
| ↳ Heating | 2,540 kWh (82%) | 2480 kWh (81%) |
| ↳ Domestic hot water | 560 kWh (18%) | 590 kWh (19%) |
| Generated thermal energy | 10,000 kWh | 10,100 kWh |
| ↳ Heating | 8,150 kWh (82%) | 8,110 kWh (80%) |
| ↳ Domestic hot water | 1,850 kWh (18%) | 1,990 kWh (20%) |
| Performance factor | 3.2 | 3.3 |
| ↳ Heating | 3.2 | 3.3 |
| ↳ Domestic hot water | 3.3 | 3.4 |
| Electric backup heater | 1.5 kWh | 20.5 kWh |
| Operating hours | 4,033 h | 4,110 h |
| Compressor starts | 727 | 533 |
| ↳ Heating | 524 | 326 |
| ↳ Domestic hot water | 203 | 207 |
In each of the first two years, our heat pump consumed approximately 3,100 kWh. This produced 10,000 kWh of heat per year. This is interesting because it is significantly less than what our old, presumably very inefficient gas heating system required. Presumably, one third of the heat from the gas heating system was lost through the chimney.
In the first two years, this resulted in a seasonal performance factor (SPF) of 3.2 and 3.3, respectively. One reason why the seasonal performance factor is relatively low could be that we have quite a lot of windows facing south and, as soon as the sun is shining and it gets warmer and the heat pump’s efficiency would produce good values, our house is heated so much by the sun that the heat pump is no longer needed. In addition, the standby consumption of our very small heat pump has a relatively significant impact. This effect is considerably lower in larger systems with higher output.
Furthermore, compared to many other manufacturers, the Bosch/Buderus heat pump deducts the energy ‘lost’ during defrosting from the generated energy. The diagram below shows that the thermal output is negative and therefore even causes the performance factor to become negative.
Finally, it should be noted that the electrical energy, and therefore also the performance factor, includes the complete peripheral equipment. This includes 2 pumps, the control system of the indoor and outdoor units, as well as compressor and condensate pan heating. These consumers were not taken into account in the gas heating consumption and would actually have to be added on top.
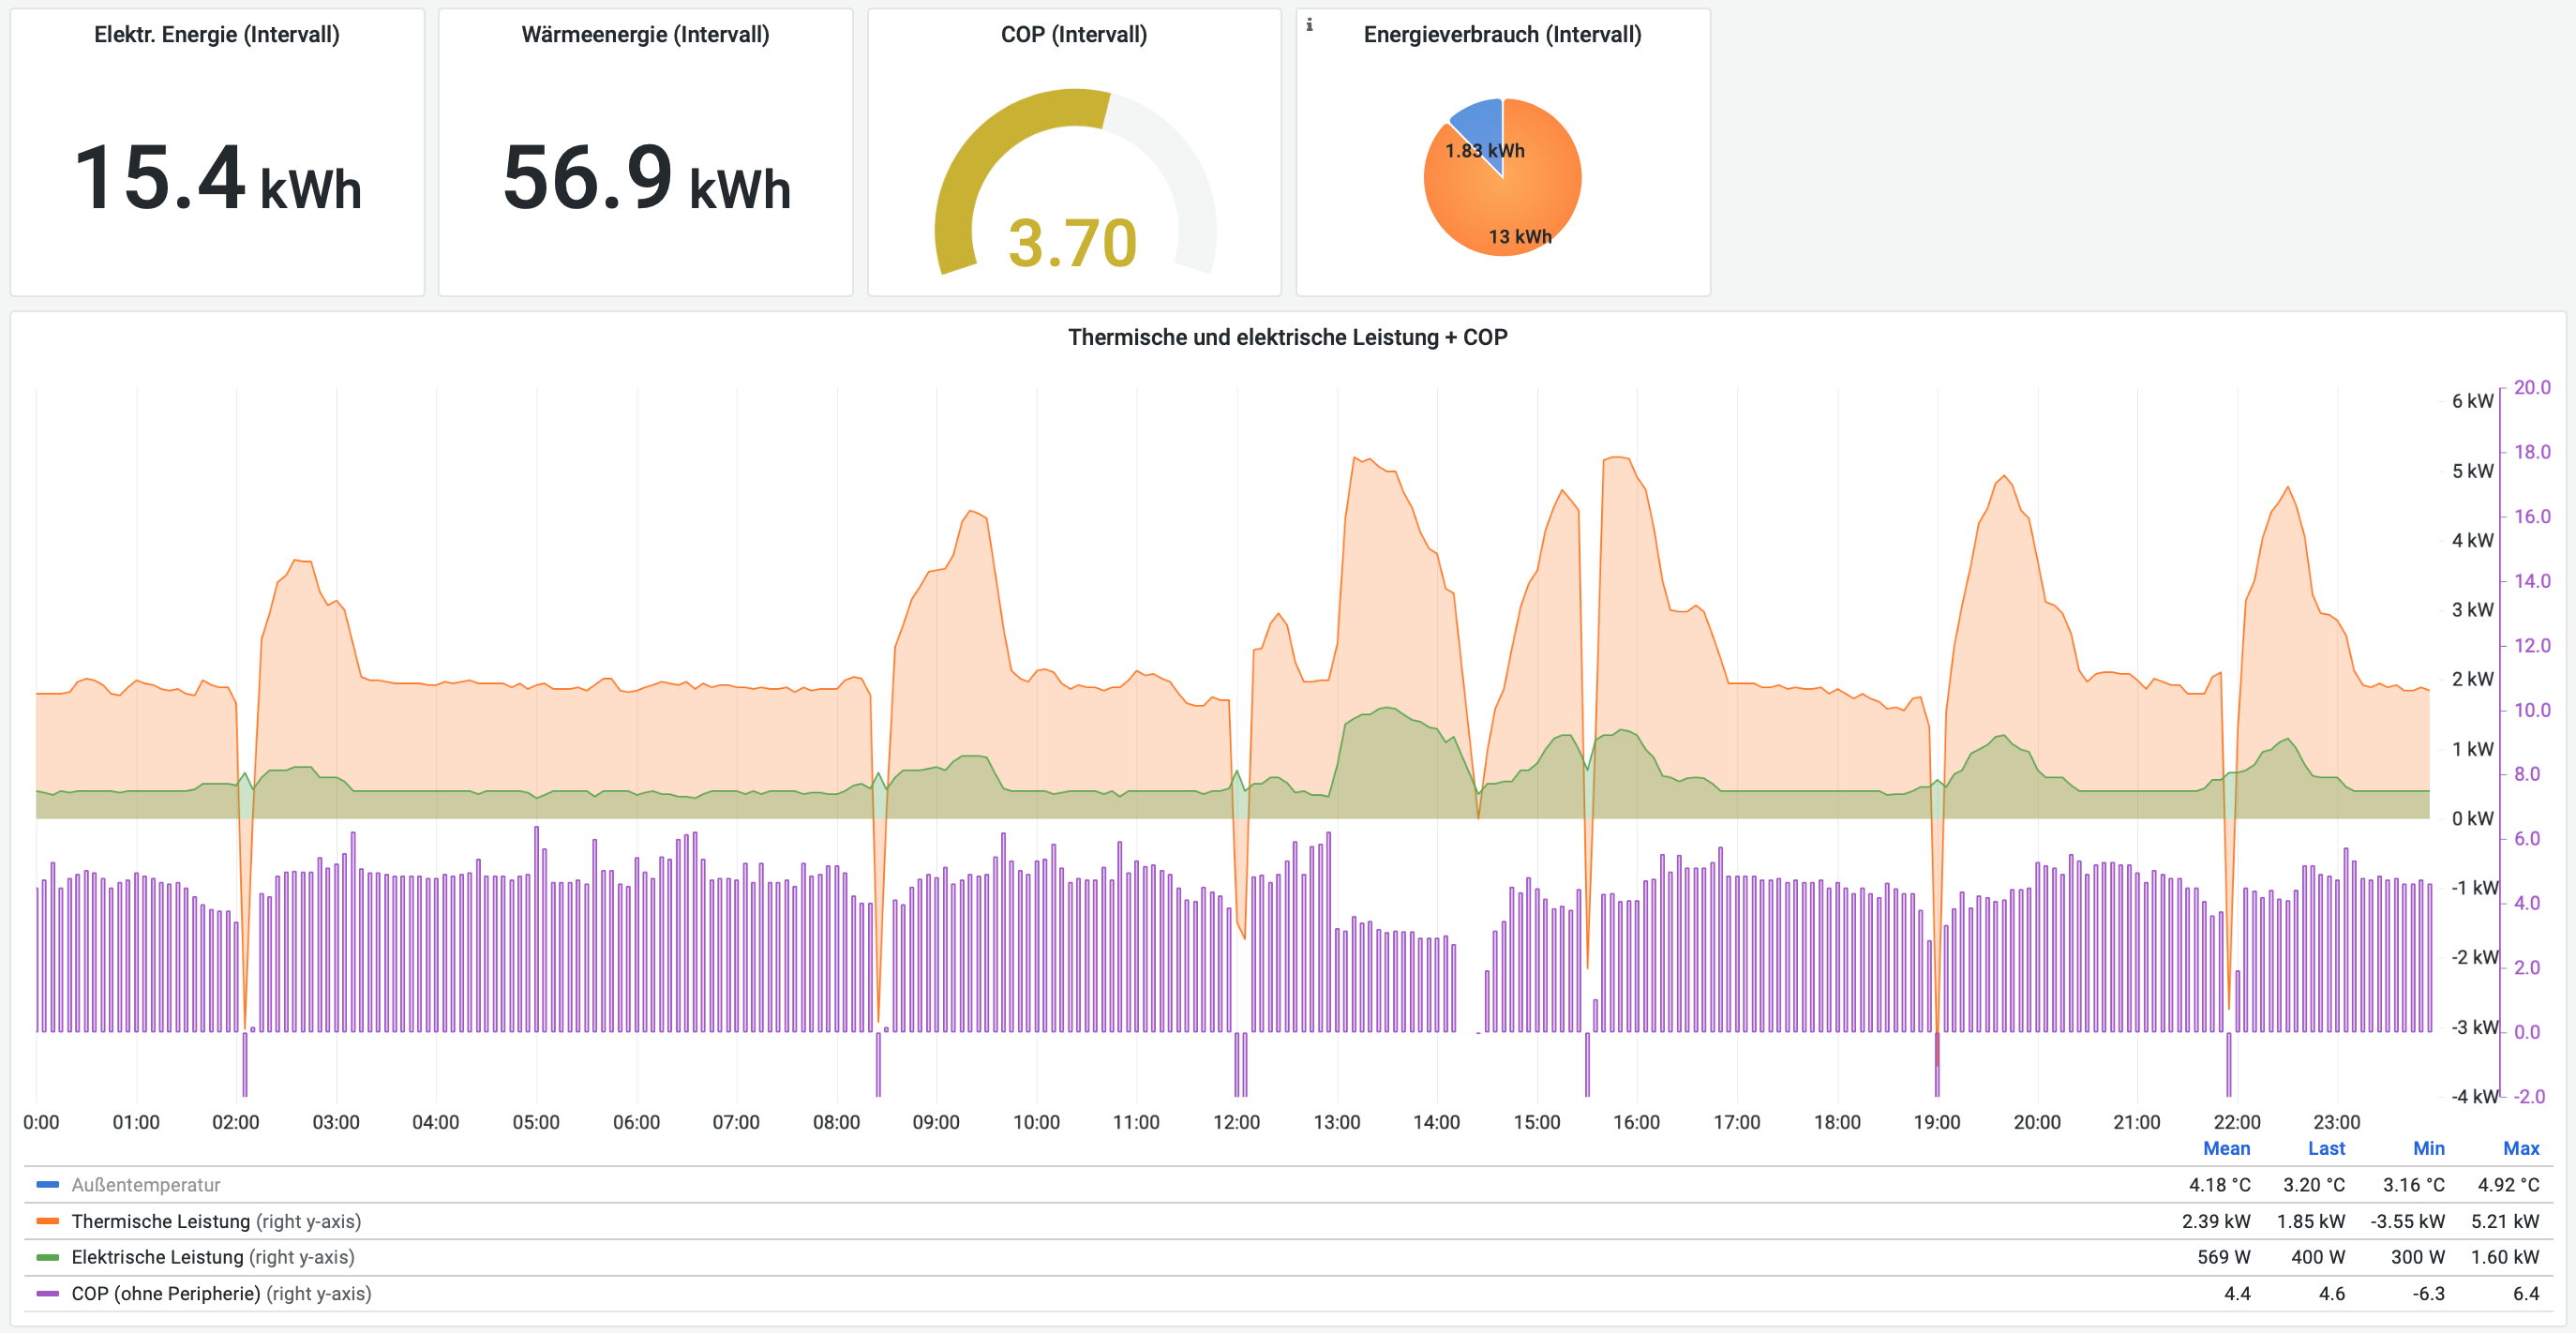
The diagram shows the electrical and thermal output on an exemplary wet winter day with an outdoor temperature of 4 °C. Domestic hot water production takes place between 13:00 and 14:15. The daily performance factor (including complete peripheral equipment) was 3.7 on this day.
Domestic hot water
We have optimized our settings so that daily domestic hot water production almost always takes place between 13:00 and 15:00. For this, approximately 1-2 kWh of electrical energy is used—with a performance factor of 2-4 depending on the outdoor temperature.
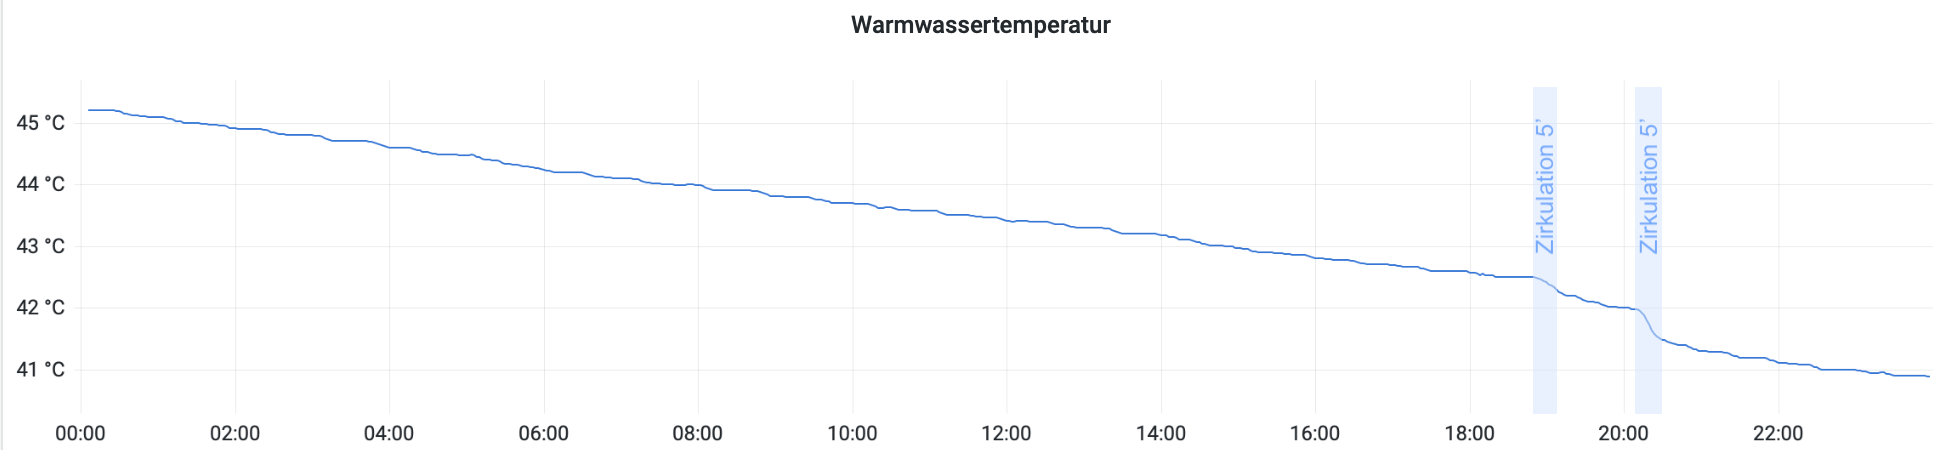
The temperature loss of our domestic hot water tank over 24 hours is:
- 4.3 K with circulation (2x5 minutes)
- 3 K without circulation
Design
Over 365 days, the heat pump ran for 4,000 hours and the compressor had to start approximately 630 times during this period. This resulted in an average of 1.7 starts/day, and a compressor run lasted 6.3 hours. In summer, when there was no heating operation, there was one start every day for domestic hot water production, and in winter the system was usually still heated up enough after domestic hot water production that the compressor was allowed to take a break for some time. One compressor start per day was therefore set for almost the entire year. The remaining approximately 300 compressor starts were due to cycling during the transitional period. In my view, these are quite good values, and the heat pump appears to be well designed at the cycling limit (approx. 8 °C).
This naturally raises the question of whether the good design at the cycling limit had negative effects on the bivalence point and whether the backup heater perhaps had to be switched on very often. This is not the case. In the first year, the backup heater ran exactly once for approximately 30 minutes, and in the second year on the rather cold days with -12 °C for a total of approximately 3 hours.
Use of PV and dynamic electricity tariff
It is repeatedly claimed that photovoltaic systems can contribute little energy to heat pumps because a lot of heating output is required in winter but little PV energy is generated. We have a 6.9 kWp east-south-west system with an 11.5 kWh home battery. We also have a dynamic electricity tariff from Tibber with hourly billing.
The following table shows consumption, self-sufficiency and costs from March 20, 2024 to March 19, 2025.
| Month | Consumption | Self-sufficiency | PV share | Grid share | ⌀ Electricity price | Cost |
|---|---|---|---|---|---|---|
| March | 85 kWh | 70% | 60 kWh | 26 kWh | 25 ct/kWh | €6.38 |
| April | 185 kWh | 78% | 144 kWh | 41 kWh | 26 ct/kWh | €10.58 |
| May | 51 kWh | 85% | 43 kWh | 8 kWh | 25 ct/kWh | €1.91 |
| June | 54 kWh | 92% | 50 kWh | 4 kWh | 27 ct/kWh | €1.17 |
| July | 33 kWh | 99% | 33 kWh | 0 kWh | 26 ct/kWh | €0.09 |
| August | 32 kWh | 99% | 32 kWh | 0 kWh | 31 ct/kWh | €0.10 |
| September | 77 kWh | 89% | 69 kWh | 8 kWh | 25 ct/kWh | €2.12 |
| October | 136 kWh | 68% | 92 kWh | 44 kWh | 26 ct/kWh | €11.32 |
| November | 437 kWh | 54% | 236 kWh | 201 kWh | 30 ct/kWh | €60.31 |
| December | 609 kWh | 17% | 104 kWh | 505 kWh | 29 ct/kWh | €146.59 |
| January | 645 kWh | 23% | 148 kWh | 497 kWh | 32 ct/kWh | €158.93 |
| February | 496 kWh | 39% | 193 kWh | 303 kWh | 36 ct/kWh | €108.92 |
| March | 217 kWh | 72% | 156 kWh | 61 kWh | 32 ct/kWh | €19.44 |
| Total | 3057 kWh | 1360 kWh | 1697 kWh | 31 ct/kWh | €527.84 | |
| 45% | 55% |
Thus, the PV system supplied approximately 1360 kWh (45%) for heat pump operation, which pleasantly surprised me. The electricity purchased for the heat pump cost approximately €530 with the dynamic tariff (⌀ 31 ct/kWh).
In year 2 (March 20, 2025 - March 19, 2026), we also purchased an electric car, which increased electricity consumption and therefore reduced self-sufficiency. Nevertheless, the heat pump was supplied with PV electricity at 40%:
| Month | Consumption | Self-sufficiency | PV share | Grid share | ⌀ Electricity price | Cost |
|---|---|---|---|---|---|---|
| March | 85 kWh | 80% | 68 kWh | 17 kWh | 31 ct/kWh | €5.27 |
| April | 122 kWh | 96% | 117 kWh | 5 kWh | 28 ct/kWh | €1.40 |
| May | 87 kWh | 97% | 84 kWh | 3 kWh | 27 ct/kWh | €0.81 |
| June | 50 kWh | 98% | 49 kWh | 1 kWh | 28 ct/kWh | €0.28 |
| July | 48 kWh | 98% | 47 kWh | 1 kWh | 31 ct/kWh | €0.31 |
| August | 51 kWh | 98% | 50 kWh | 1 kWh | 29 ct/kWh | €0.29 |
| September | 61 kWh | 91% | 56 kWh | 5 kWh | 27 ct/kWh | €1.35 |
| October | 206 kWh | 62% | 128 kWh | 78 kWh | 26 ct/kWh | €20.28 |
| November | 414 kWh | 29% | 120 kWh | 294 kWh | 30 ct/kWh | €88.20 |
| December | 627 kWh | 11% | 69 kWh | 558 kWh | 30 ct/kWh | €167.40 |
| January | 748 kWh | 22% | 165 kWh | 583 kWh | 29 ct/kWh | €169.07 |
| February | 418 kWh | 34% | 142 kWh | 276 kWh | 28 ct/kWh | €77.28 |
| March | 183 kWh | 82% | 150 kWh | 33 kWh | 29 ct/kWh | €9.57 |
| Total | 3100 kWh | 1245 kWh | 1855 kWh | 29 ct/kWh | €541.51 | |
| 40% | 60% |
Anyone interested in a dynamic electricity provider is welcome to use my Tibber referral link. Then we will both receive a €50 bonus: https://invite.tibber.com/42w39ln7. I have been with Tibber since 2023 and have been very satisfied so far.
Sustainability
Recently, I wondered how much of the energy used for our heat pump actually comes from renewable energy sources. To find out, I created a panel in Grafana that breaks down the daily energy consumption of our heat pump proportionally as follows:
- HP energy originating from the PV system (100% renewable)
- HP grid consumption:
- Renewable share of the German electricity mix on that day
- Fossil share of the German electricity mix on that day
This allows me to determine the actual share of renewable energy in the electricity consumption of our heat pump.
Calculation formula
\[
EEAnteil = \frac{E_{PV} \; + \; E_{Netz} \cdot EEAnteil_{Netz}}{E_{gesamt}}
\]
\[
= \frac{E_{gesamt} \cdot Autarkie \; + \; E_{gesamt} \cdot (1 - Autarkie) \cdot EEAnteil_{Netz}}{E_{gesamt}}
\]
\[
= Autarkie \; + \; (1 - Autarkie) \cdot EEAnteil_{Netz}
\]
The data on the German electricity mix comes from Greengrid Compass.
The daily breakdown into PV energy, renewable share, fossil share, and the resulting share of renewable energy in the second year of operation is shown in the following diagram:

The annual average share of renewable energy was an incredible 85%. The share was naturally somewhat lower in winter, but still usually above 50%. And with every additional wind turbine and every additional solar system, the share continues to rise 💚
Connection insulation
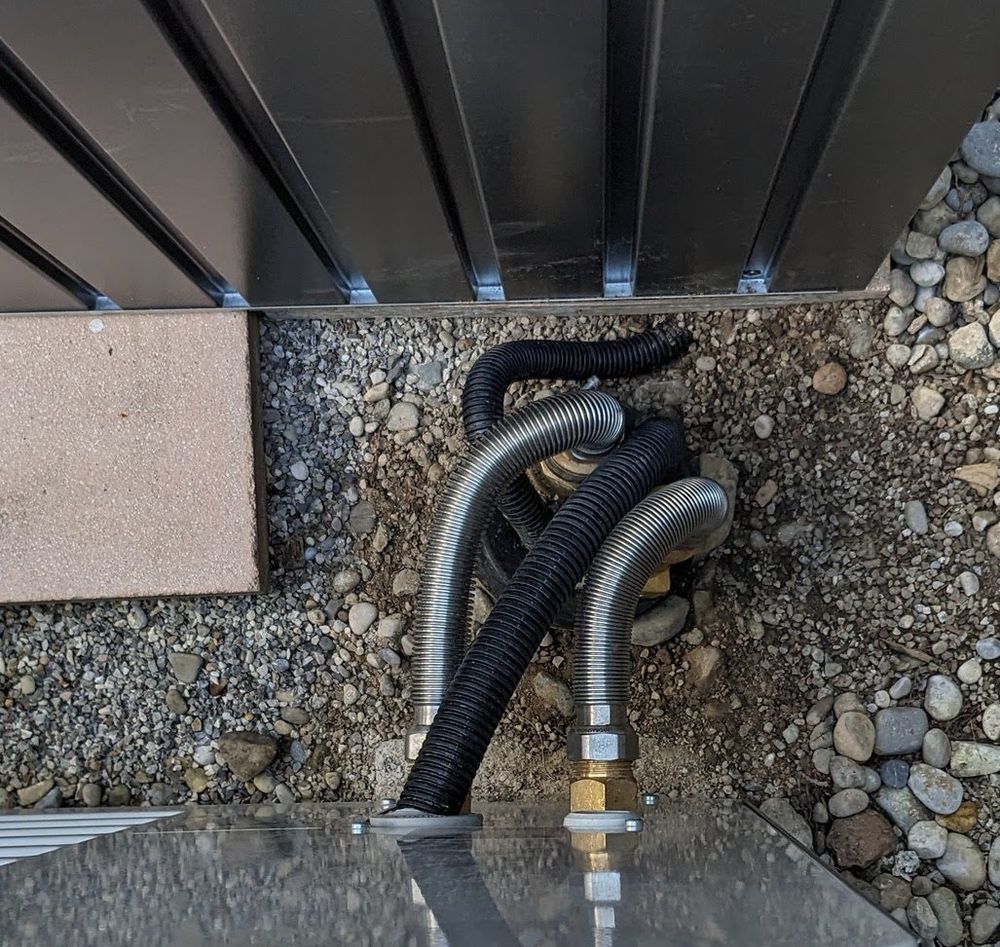
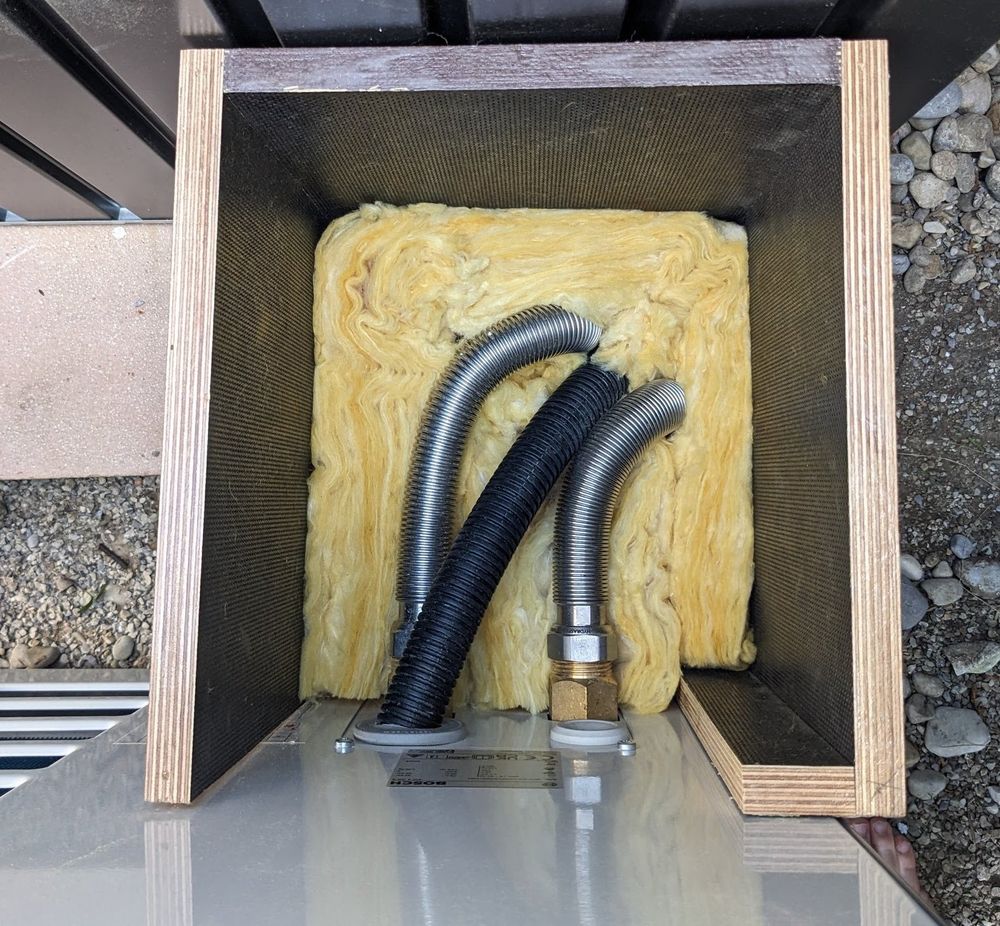
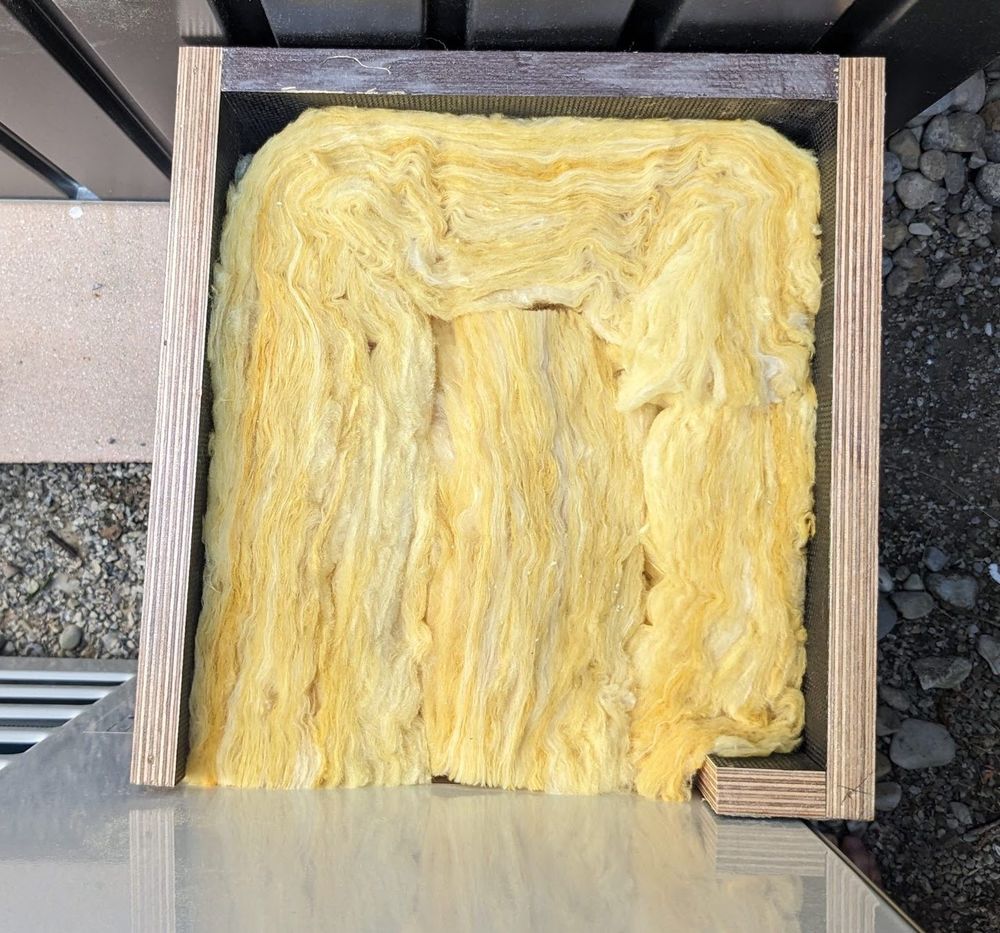
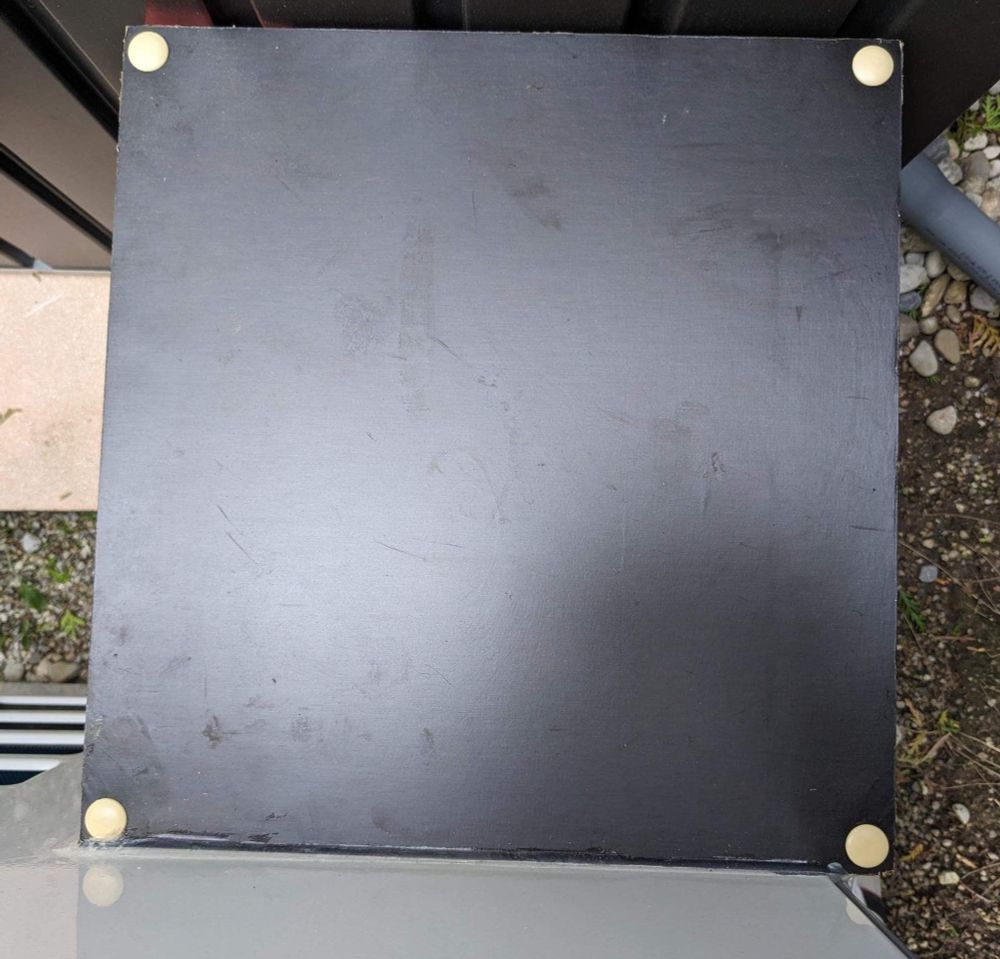
Since there was no insulation for the outdoor unit connections when we bought our heat pump, I made the insulation myself from leftover screen-printing board, mineral wool, waterproof wood glue and a few stainless-steel screws.